Most Washingtonians agree that we’re all better off when everyone chips in their share for our public schools, safe communities, affordable health care, and more. Investments like these create jobs, grow the economy, and benefit all communities.
But in Washington state, those at the top aren’t paying their share.
That’s because we have the most upside-down tax system of any state in the U.S. - one where those with the least pay the most, while the wealthiest 1% get a special deal.
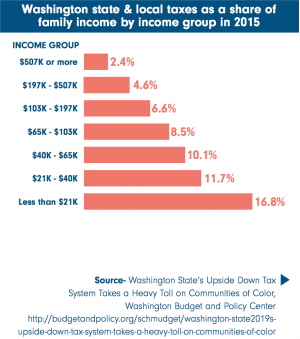
In our state, low- and middle-income families pay up to seven times more in taxes as a proportion of their income than the wealthiest families. That’s completely upside-down, and puts us in last place out of all fifty states.
Key Facts:
- The poorest fifth of Washingtonians, those with incomes below $21,000 per year, pay an average of 16.8 percent of their incomes in state and local taxes.
- The richest 1 percent of Washingtonians, who make a minimum of $507,000 per year, pay on average only 2.4 percent of their incomes in state and local taxes.
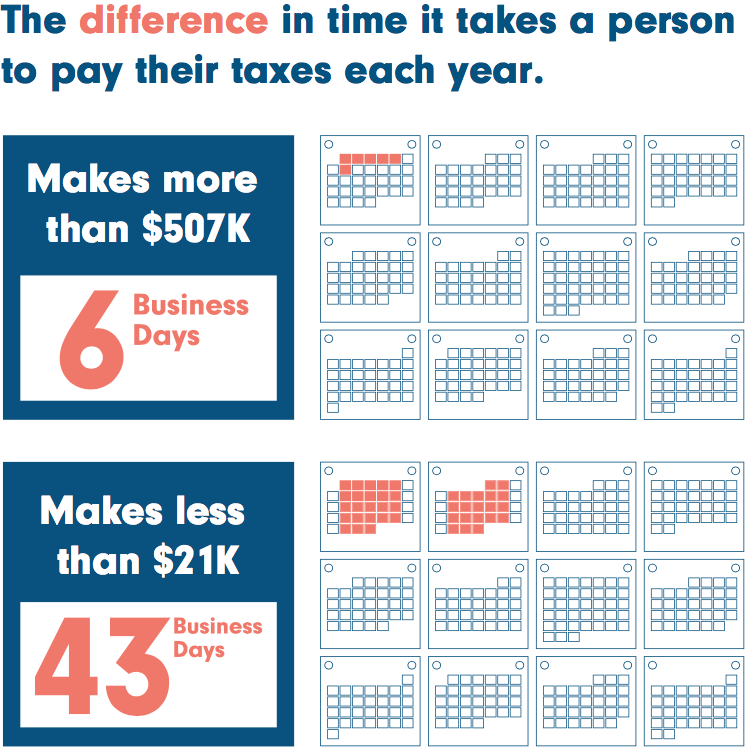
To put that into perspective, it takes the wealthiest Washingtonians just six business days to make enough money to pay their state and local taxes for the year. By contrast, it takes the poorest Washingtonians forty-three business days.
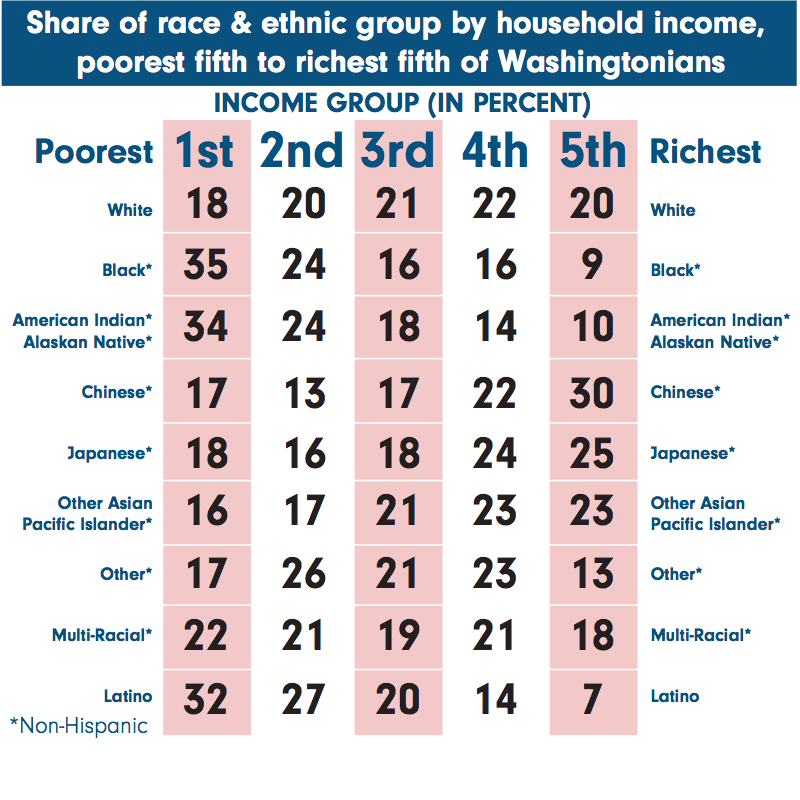
Our tax code reinforces institutional and structural racism
Washington’s upside-down tax code reinforces and exacerbates the racism that’s built into our tax system. People from communities of color are more likely than white people to be in the lower- and middle-income groups. That means that many communities of color end up paying a much larger portion of their income in state and local taxes than those at the top, who are disproportionately white.